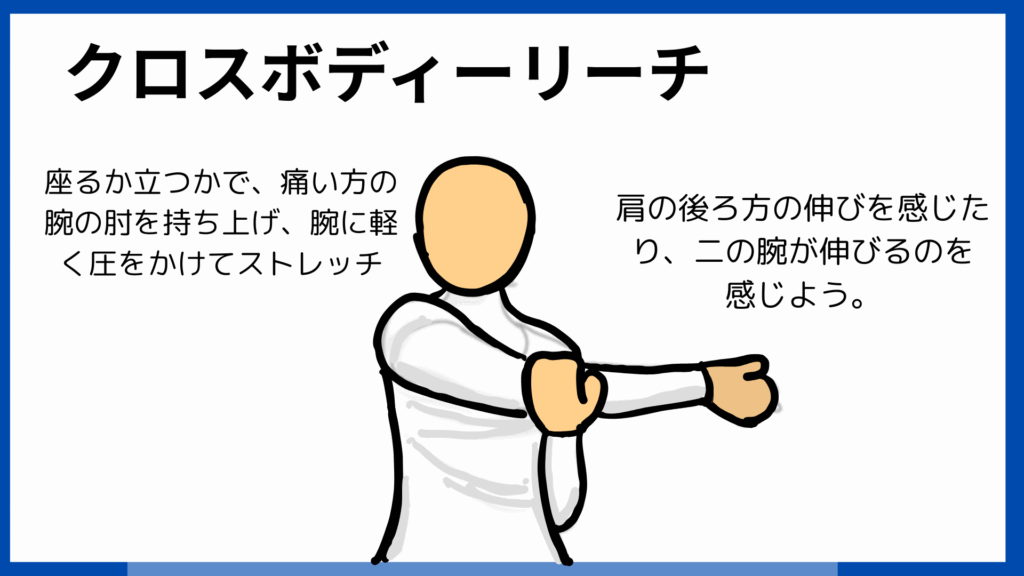
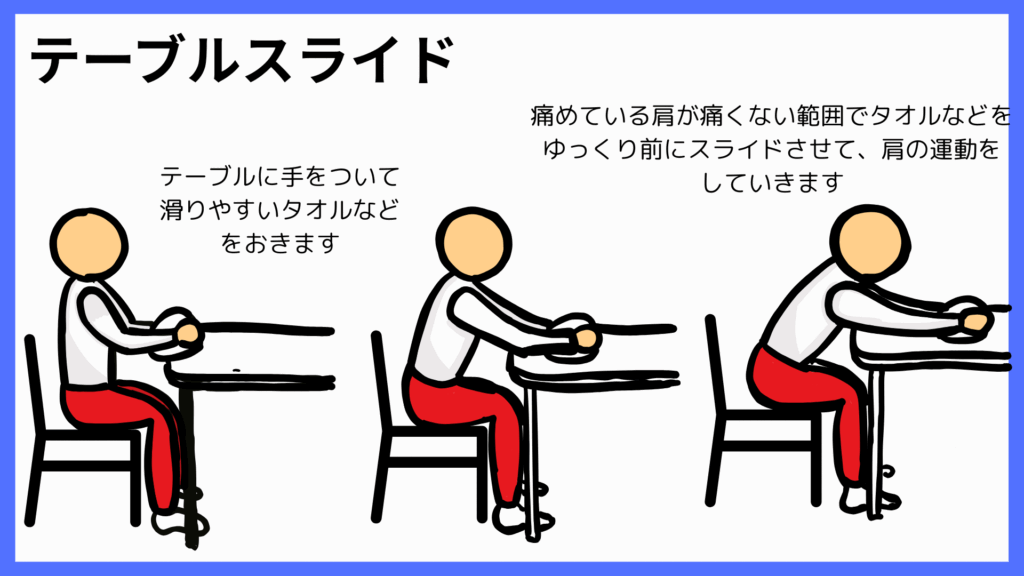
このサイトでは『家トレ』イラスト資料とイラスト資料画像の編集を提供しています.
【病院・福祉施設・訪問リハビリ・クリニック・整体院・ジム・フットネスクラブ】
などで患者、利用者、クライアントに自主トレメニューの資料としてお渡しする際に
役立てていただければ幸いです、まだ画像は少ないですが、日々更新してまいります。
更新された最新の『家トレ』資料はこちらです。↓
更新された最新のBLOG記事はこちらです↓
運動条件から検索できます。下記の画像をクリックすると、運動資料の各条件につながります

種目、競技別から検索できます。下記の画像をクリック。『家トレ』イラスト資料の種目、競技別検索可能です

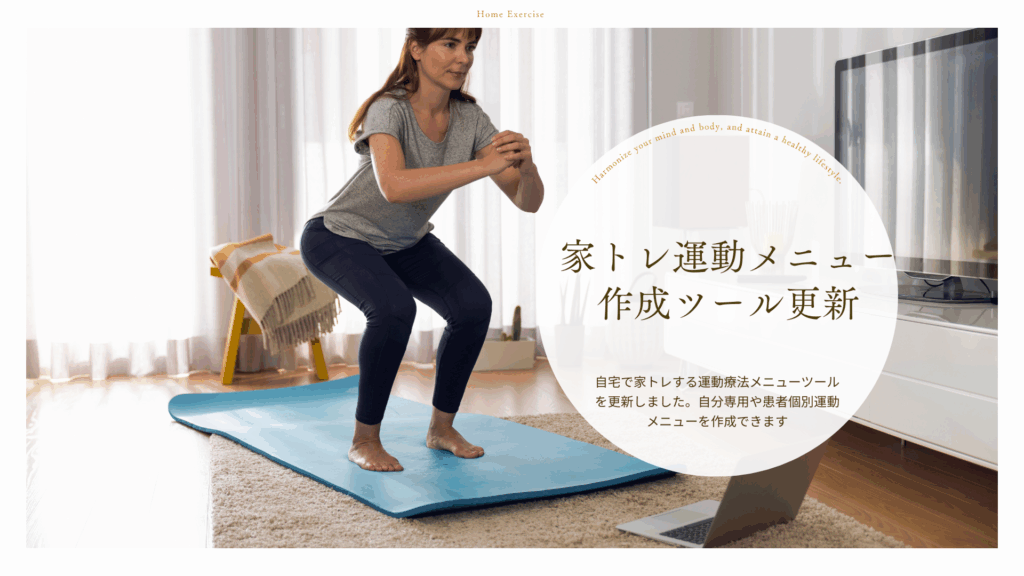
下記から家トレ運動メニューを作成できるツールを使用することができます。現在日々更新中です。

理学療法士国家試験対策、もちろん、理学療法士として必要な知識の情報をPDF、WORD EXCELなどで皆さんに活用していただくためにダウンロードできるように資料集のページを作成しました。
自分で資料作りの材料としてもOK!! 国家試験対策としてもOK!! 普段のノート作りとしてもOKですので自由にお使いくださいませ